Current Version: Profex 5.4.1 - Released November 24, 2024

Introduction
This tutorial describes a basic refinement of a 3-phase pattern. This level of refinements is typically performed for phase identification and quantification.
Preparations
Download and extract the raw data file 01-tutorial.raw.zip
Step 1: Identifying Phases
Start Profex and click „File → Open Graph File…“. Set the File Type to „Bruker Raw scan (*.raw)“ and load file „01-tutorial.raw“.
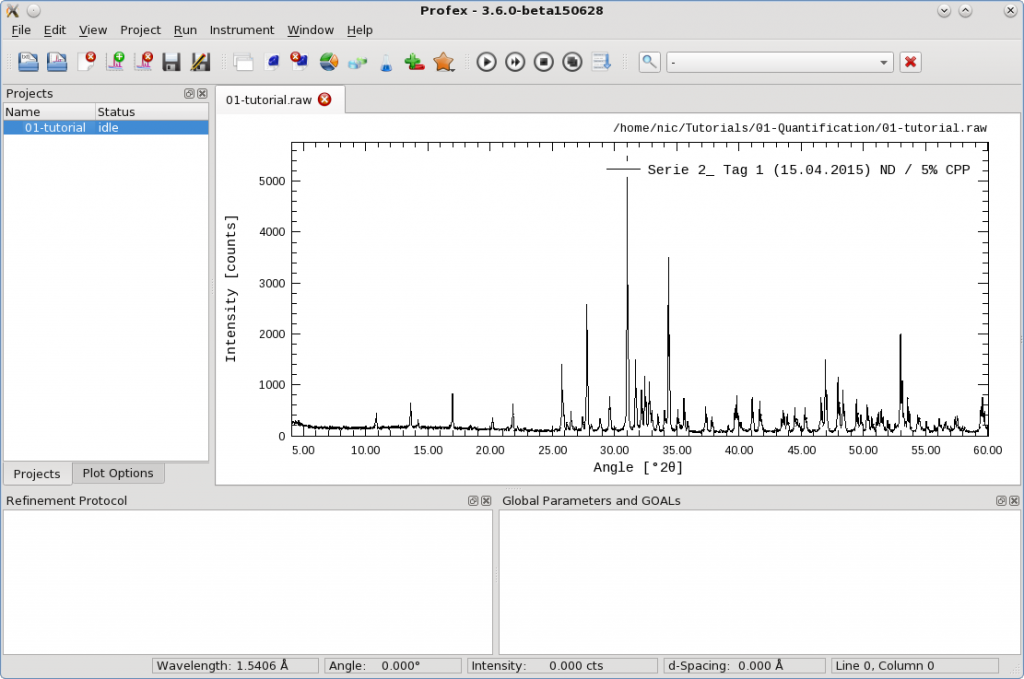
Double-click on the strongest peak at 31.02° to identify the main phase. You may have to try several times until you find a phase that matches almost all peaks perfectly. Alternatively scroll through the list of reference structures (1) until you find a good match.
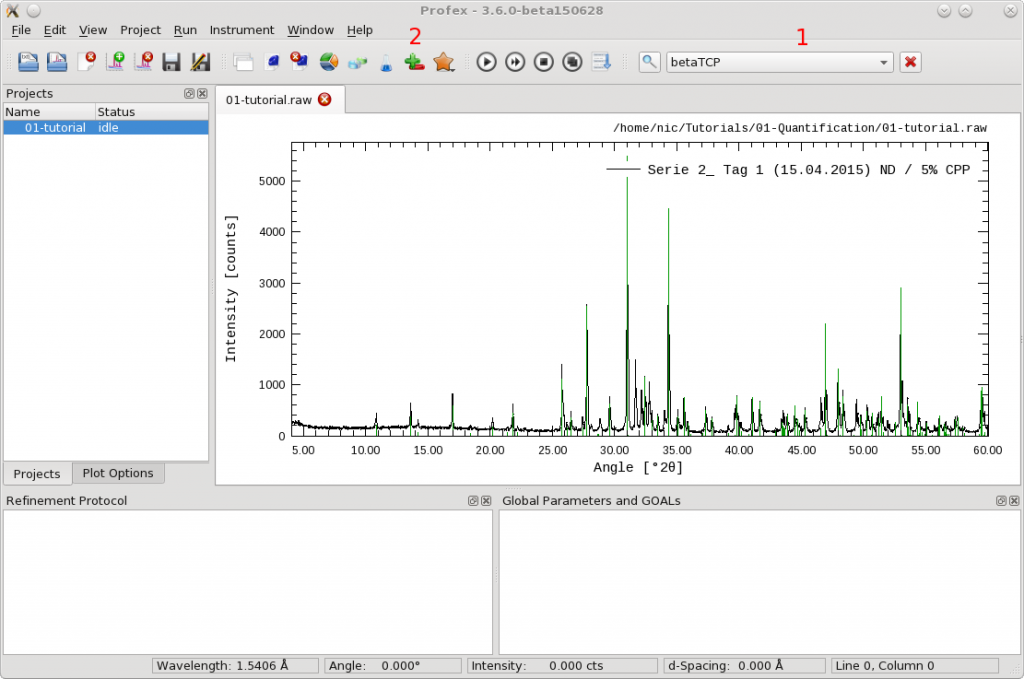
If you selected „betaTCP.str“, your choice was correct. Add it to the refinement by opening the „Add / Remove Phase“ dialog using the „+-“ button (2).
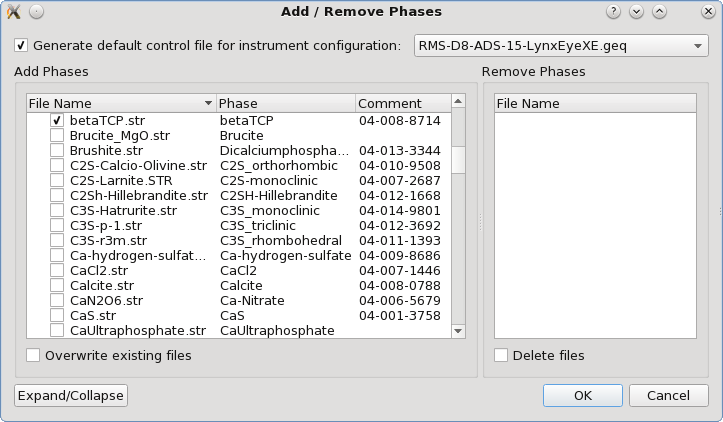
Select the instrument configuration „RMS-D8-ADS-15-LynxEyeXE.geq“. The phase „betaTCP.str“ is already selected. If not, select it. Then click „OK“. A new control file will be created:
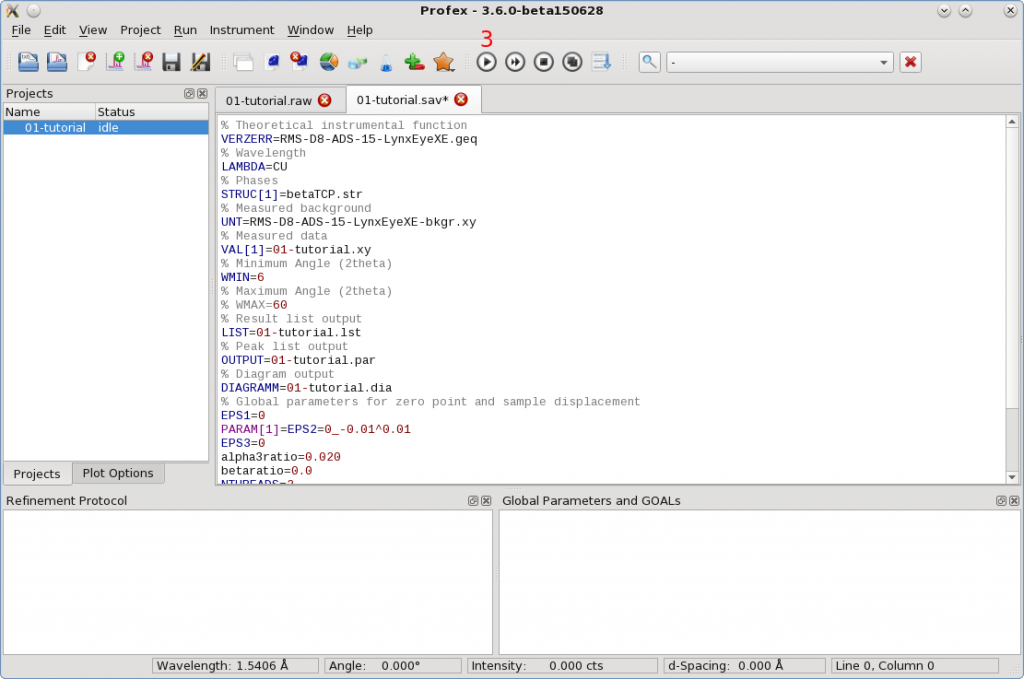
Run the refinement by clicking button (3). After completion, your fit should look like this:
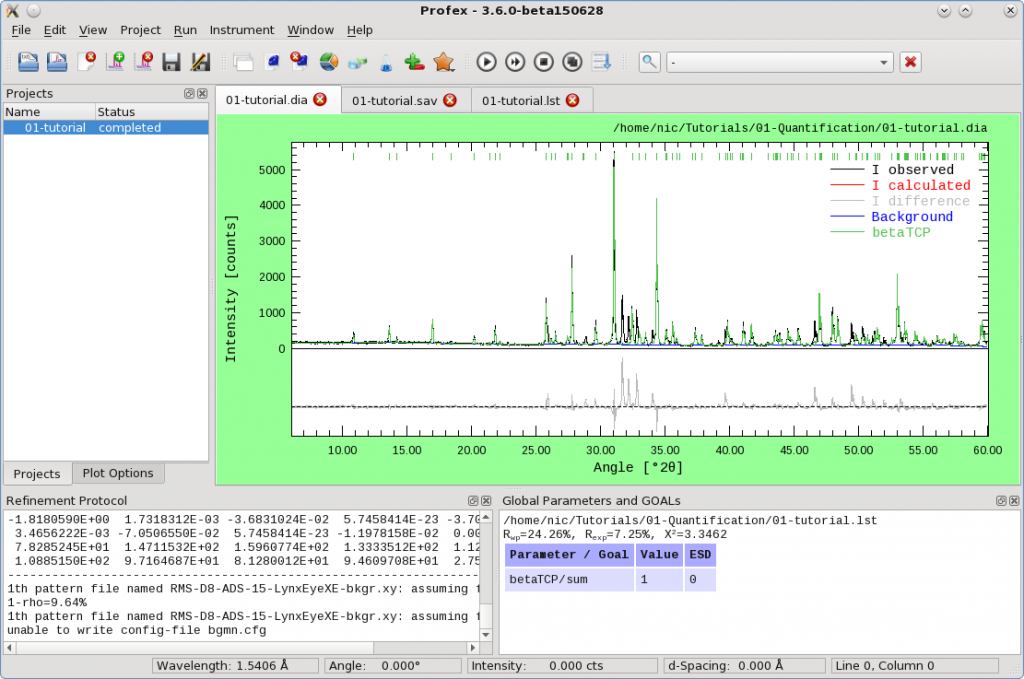
The β-TCP peaks were assigned correctly, but there are more peaks (between 31.5 and 32.5°). Try to identify them by clicking the strongest one or browsing the reference structure list as above. The phase „hydroxyapatite.str“ matches, but the peak positions are slightly shifted:
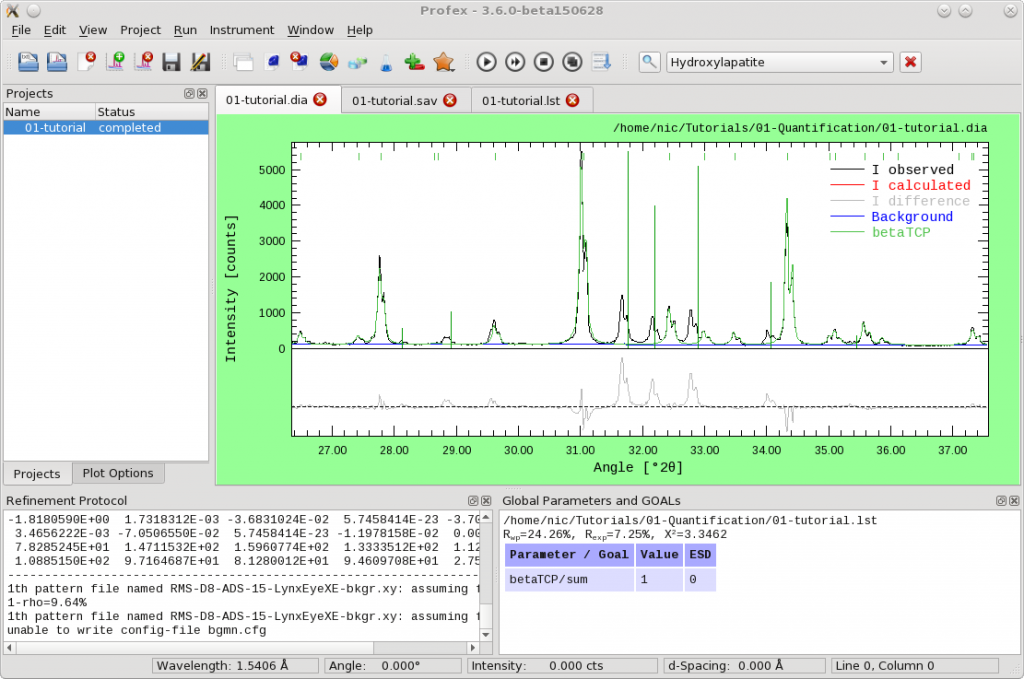
Add it anyway using the „Add / Remove Phase“ dialog (+- button). Then repeat the refinement.
Almost all peaks are now assigned to a phase. But if we zoom into the area between 25 and 35°, we will still see some weak peaks of a third phase:
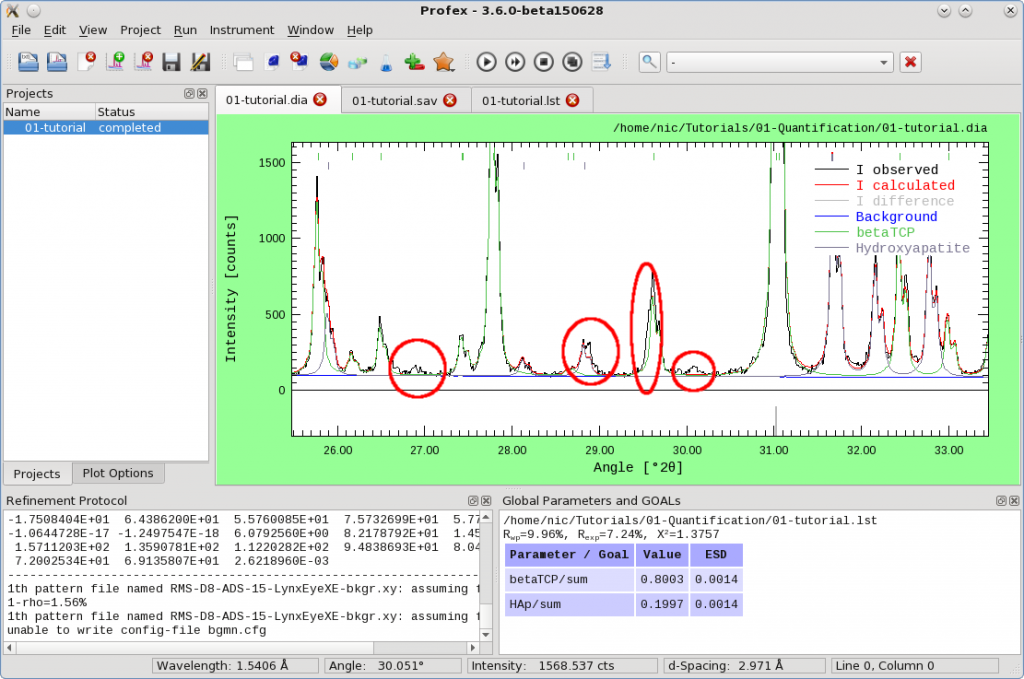
Browse the reference structure list again to identify them. If you choose „betaCPP.str“, congratulations, your choice is correct. Add it to the refinement using the „Add / Remove Phase“ dialog (+- button). Then repeat the refinement. After completion, there are no more unknown phases:
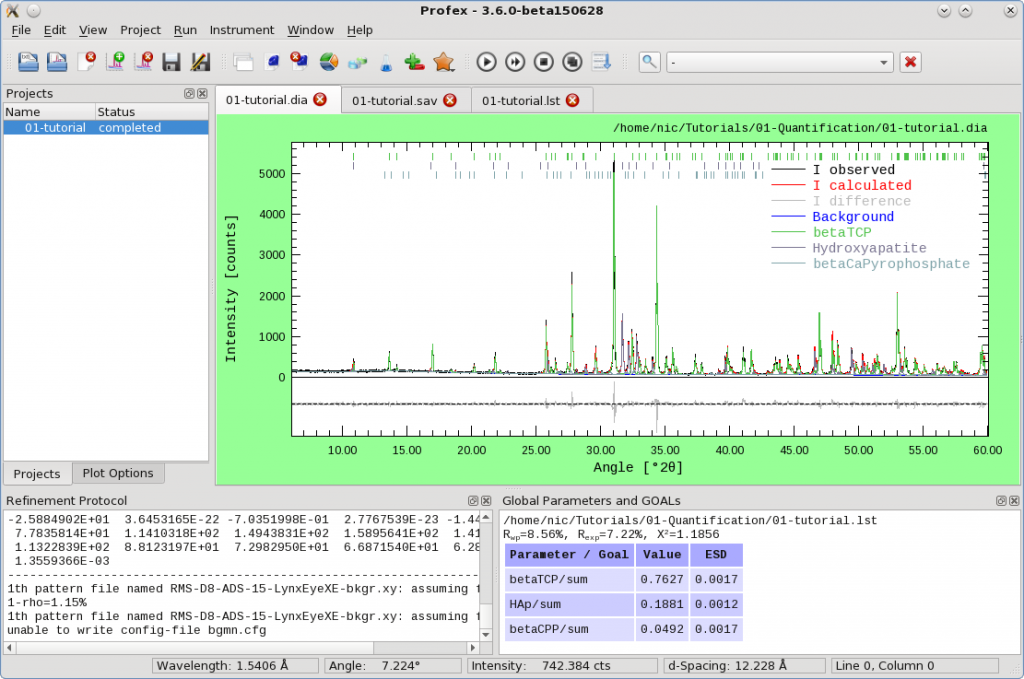
Phase identification is complete.
Step 2: Optimizing the Fit
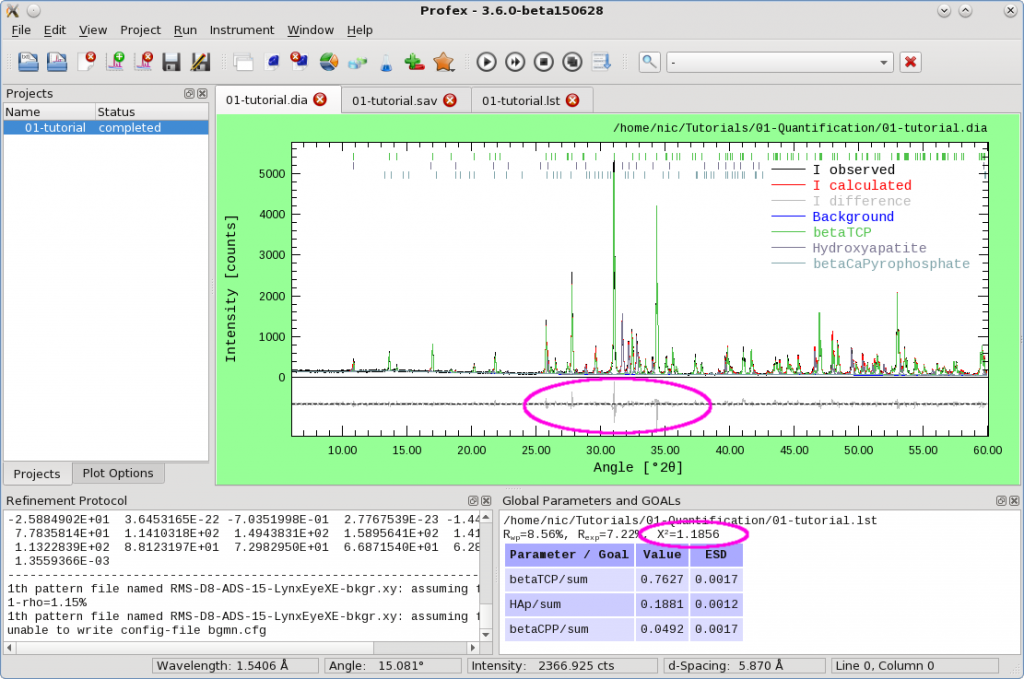
At the end of the previous step all phases were identified and the refinement resulted in a χ2 value of 1.1856. The difference curve still shows differences between the calculated and measured intensities, mainly of the β-TCP phase:
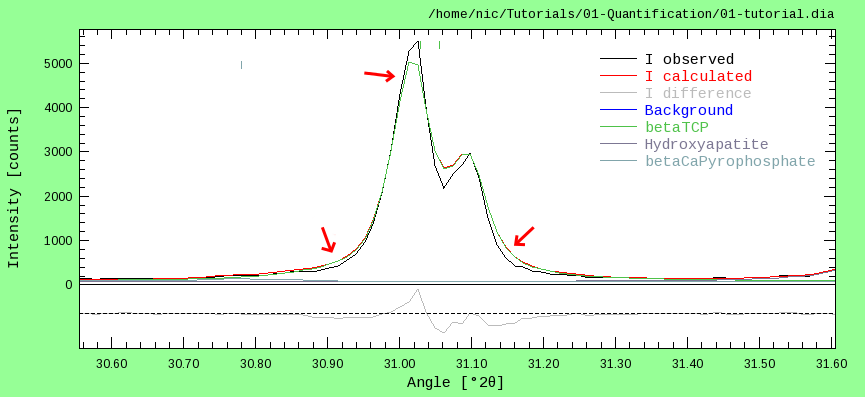
Before we can trust the refined phase quantities, we need to improve the fit. By zooming into the scan and analyzing the origin of the differences, it becomes evident that the shape of the β-TCP peaks are not fitted correctly. The feet are too wide, and the tips too narrow. The position and intensity, on the other hand, seem to be fitted correctly:
As the differences are only related to the β-TCP phase, we need to edit the β-TCP structure file. Open it by clicking button (4) and going to the „betaTCP.str“ tab (5):

We will focus on the following line:
RP=4 k1=0 k2=0 PARAM=B1=0_0^0.01 GEWICHT=SPHAR4 //
The peak shape is mostly refined by the parameters k2 (micro-strain) and B1 (crystallite size). Currently, crystallite size is refined isotropically and micro-strain is not refined. We can try to improve the fit by refining micro-strain isotropically, and crystallite size peak broadening anisotropically. To do so, change the line to:
RP=4 k1=0 PARAM=k2=0_0^0.0001 B1=ANISO^0.01 GEWICHT=SPHAR4 //
You don’t have to type this. Place the text cursor on the k2 parameter and click with the right mouse button. Then select „Refine isotropically“ from the menu. Do the same on the B1 parameter, but select „Refine anisotropically“. Instead of the right mouse button, you can also toggle the parameters by using the F5 and F6 keys on the keyboard.
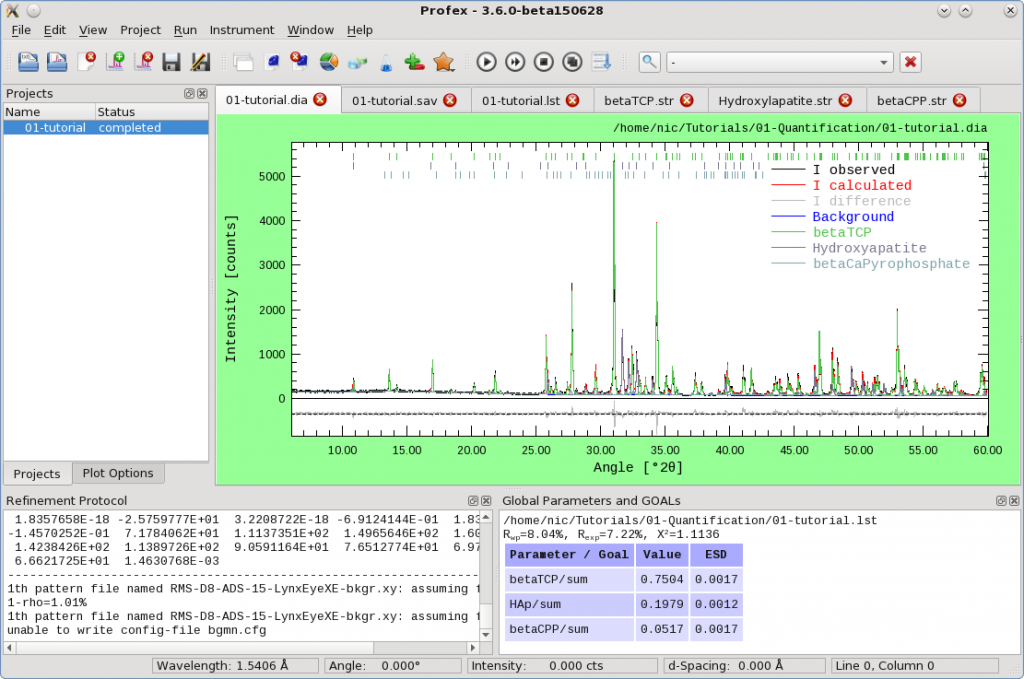
Then repeat the refinement. χ2 is now reduced to 1.1136 (ideally it should become 1.0), and the fit looks better:
One more common parameter to refine is texture, also called „preferred orientation“. It is refined with the GEWICHT parameter in the same line:
RP=4 k1=0 PARAM=k2=0_0^0.0001 B1=ANISO^0.01 GEWICHT=SPHAR4 //
If the GEWICHT parameter is refined as „SPHAR0“, no texture is refined (perfectly random crystal orientation is assumed). Increasing the parameter to „SPHAR2“, „SPHAR4“, „SPHAR6“, „SPHAR8“, or „SPHAR10“ will use increasingly complex mathematical models to refine texture. The default using „SPHAR4“ is a moderately complex model. We can try to improve the fit by increasing it to „SPHAR8“:
RP=4 k1=0 PARAM=k2=0_0^0.0001 B1=ANISO^0.01 GEWICHT=SPHAR8 //
And since hydroxyapatite is also prone to texture, edit the „hydroxyapatite.str“ file and increase texture refinement to „SPHAR6“. Do not increase it more, because the hydroxyapatite diffraction signal is a lot weaker and thus less well defined than the β-TCP signal.
RP=4 k1=0 PARAM=k2=0_0^0.0001 B1=ANISO^0.01 GEWICHT=SPHAR6 //
Then repeat the refinement. As a result, χ2 is improved to 1.0766.
If you continue playing with the parameters k1, k2, B1 and GEWICHT of all three phases, you will realize that the fit cannot be improved any further. But for now it is not necessary, the difference curve looks fairly straight and χ2 is close to 1.0. We can consider the phase quantification completed. The summary table lists the results:
betaTCP: 75.41 ± 0.17 wt-%
HAp:     19.61 ± 0.12 wt-%
betaCPP:  4.98 ± 0.16 wt-%
Considering that the sample was a mixture of β-TCP and hydroxyapatite (HAp) in an unknown ratio, spiked with 5.0 wt-% β-CPP, the results are extremely accurate.
Nicola Döbelin, June 2015
